Found 62 blog entries tagged as KCM.

In today's Market Updates series, we bring you another info-graphic from our friends over at KCM (KeepingCurrentMatters.com).
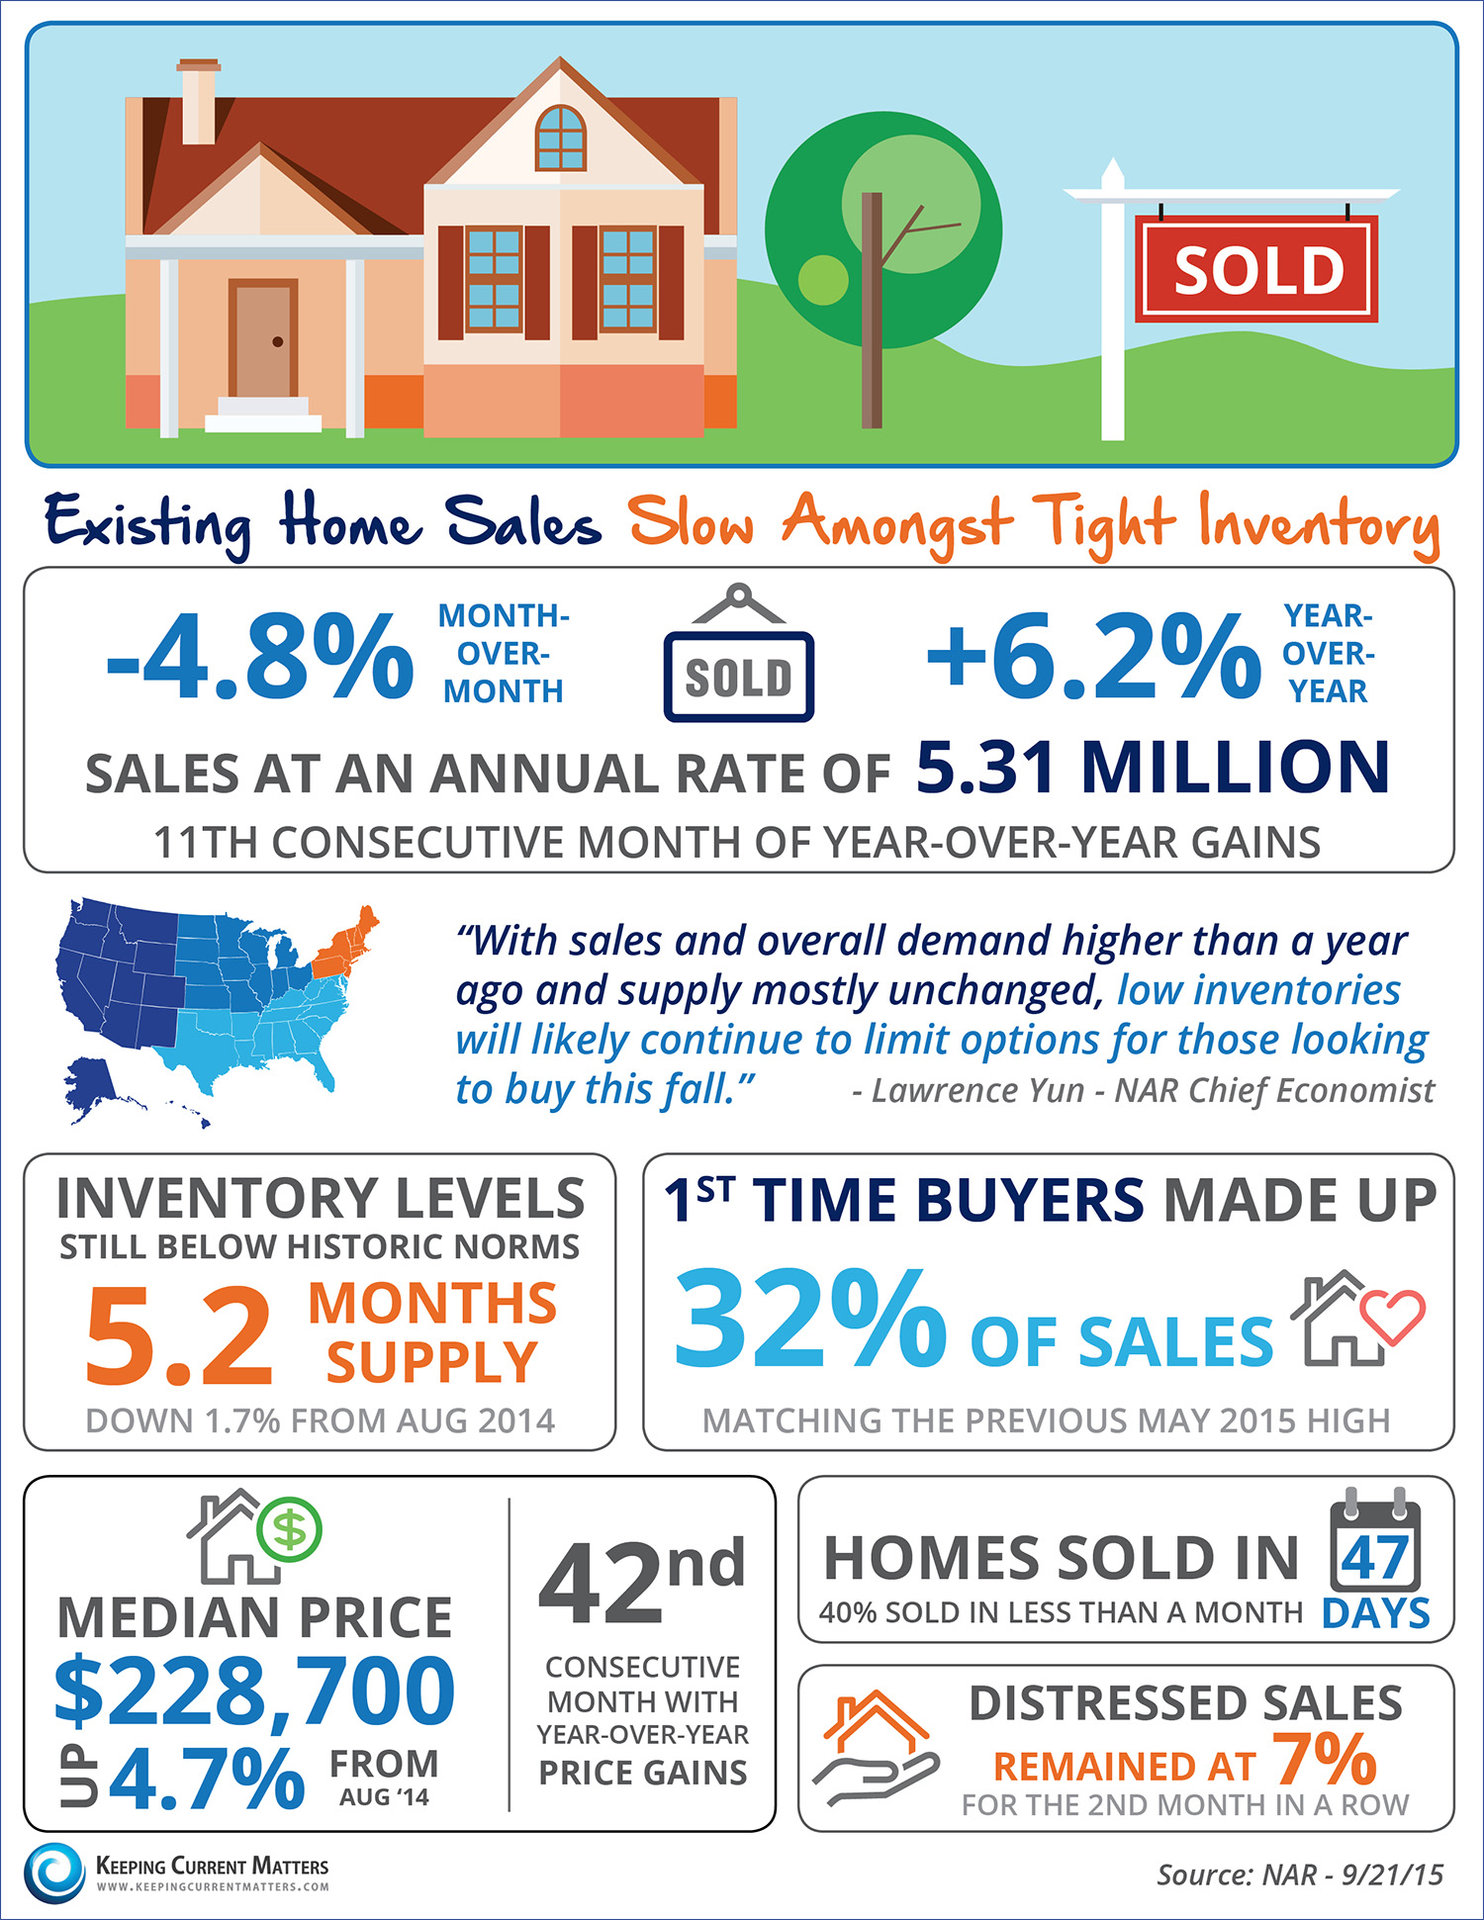
According to the info-graphic above, Lawrence Yun - the NAR Cheif Economist said, "With sales and overall demand higher than a year ago and supply mostly unchanged, low inventories will likely continue to limit options for those looking to buy this fall."

Inventory levels are still below historic norms, down 107% from August 2014. First time buyers made up 32% of sales, matching the previous May 2015 high. 40% of homes are being sold in less than a month. 

With inventory so low, but demand so high, there is no better time than right now to put your house on the market!

Call us today for a free house estimate! 718-442-4400

1098 Views, 0 Comments

In today's Market Updates series, we will be looking at a new info-graphic from our friends at KCM (KeepingCurrentMatters.com) and discussing everything you need to know about the mortgage process. 

What You Need To Qualify In Today's Market:

1 - A down payment of anywhere from 5-20% of the purchase price.

2- Income Verification, Credit History, and Asset Documentation.

3- Impartial 3rd Party Appraisal.

4- Stable Income.

5 - Good Credit History. 

With all these things to keep track of, it seems like buying a home could be difficult! The bottom line? Do your research, reach out to professionals, stick to your budget, and be sure you're ready to take on the financial responsibilities of being a homeowner!

Call us today for more…

1385 Views, 0 Comments

Today in our Market Updates series we will be talking about boomerang buyers and what their recovery means for the housing market.

As seen in the infographic above provided by our friends at KCM, a boomerang buyer is defined as a former homeowner who has gone through a "short sale," "foreclosure," or "bankruptcy" in the past few years and has been saving for a downpayment in preparation of the expiration of the waiting period, in order to qualify once again for a mortgage. 

Between 2006 and 2014 over 7 million homeowners went through a short sale or foreclosure. However, in 2014 about 350,000 homes were sold to return buyers. According to the National Association of Realtors up to 1 million consumers have already restores their credit since the…

1200 Views, 0 Comments

Today in our Market Updates series, we have some interesting information about the average interest rates and mortgage payments throughout the last 4 decades and into today. 

The infographic above, provided by our friends at KCM (Keeping Current Matters) shows the difference in interest rates and mortgage payments from the 70's to today. In the 70's the average interest rate was at 8.86% with average mortgage payments costing about $1,589. In the 80's the average interest rate skyrocketed to a whopping 12.7% with average mortgage payments costing about $2,166. In the 90's interest rates lowered to a similar 70's rate at 8.12% with an average mortgage payment of $1,484. In the 2000's the interest rate lowered again to about 6.29% with average…

1261 Views, 0 Comments

In today's edition of Market Updates, we'll be using this amazing infographic from our friends at KCM (Keeping Current Matters) to discuss the benefits of hiring a real estate agent.     Whether you are buying or selling, hiring a real estate agent holds many advantages for everyone involved in the buying/selling process. They understand all the paperwork that has to be filled out, know all the tips and tricks for negotiating deals, have knowledge and experience in all aspects of real estate, know the proper values of any home, and have a clear understanding of the current market conditions. Hiring a real estate agent makes every step of buying or selling a home a simpler process. You'll have a cunning and educated person taking care of all…

1342 Views, 0 Comments

Today in our Market Updates series, we're going to talk a little bit about the cost of buying your home, versus renting it. Our friends at KCM (KeepingCurrentMatters.com) have provided us with an excellent infograph to help illustrate the situation. 

The graph above shows the percentage of your monthly income you can expect to pay on your housing costs when renting or mortgaging your home. Historically, you could have expected to spend 22% of your monthly income on a mortgage payment, and 25% on a monthly rent payment. However, today we can see that the percentage of your monthly income that would be spent on a mortgage payment has dramatically decreased (bringing it down by 6.3% to a total of 15.3%), while that of a rent payment has dramatically…

1379 Views, 0 Comments

Today in our Market Updates series, our friends at KCM (KeepingCurrentMatters.com) have provided us with a wonderful infographic about the difference only an hour can make when talking about the housing market.


According to the graph, about 550 homes sell, the median home values go up $1.34, and prices rise approximately .0007% every hour in the United States. This only goes to show that every hour makes a huge difference when buying or selling a home!  

Thanks to our friends at KCM, for more from KCM, visit http://www.KeepingCurrentMatters.com or check out our other KCM articles here!

1405 Views, 0 Comments

Today in our Market Updates series, we have some interesting information on why this winter might be the best time to put your house on the market!

The infograph above shows that the months where the most listings come on the market are April, May, and June, (the second quarter of each year).

In the infographic above, we can see that the time of the year that most people put their houses on the market is the Spring. April, May, and June are recorded as the most popular months for houses to be put up for sale. So why should you put yours up for sale NOW?

Because if you wait for the Spring, not only do the number of buyers rise, but the number of sellers rise as well. You suddenly have so much competition, and it could be much harder and take a…

1922 Views, 0 Comments

Our friends at KCM (KeepingCurrentMatters.com) have provided us with yet another amazing infographic, and 5 reasons why you're not doing yourself any favors by listing your home as "For-Sale-By-Owner."

Pictured above is the beautiful infographic from KeepingCurrentMatters.com where they compare and contrast the advantages and disadvantages of putting your house up as "For Sale By Owner" over using an agent.

1. There Are So Many People To Negotiate With

The buyer, the buyers agent, the buyers bank, the inspection company, the appraiser, and the title company are only some of the people you're going to have to speak to and negotiate with. It's not the ideal situation for someone  who doesn't know much about the industry, and it can also be a…

1942 Views, 0 Comments

Our friends at KeepingCurrentMatters.com, (KCM), have provided us with beautiful infographics that give you 15 reasons why owning a home is a much better choice than renting one! And, millennial's, this is your time!

By owning a home, you invest in yourself, your family, your community, and your future.

When you own your own home, you're part of a community. You'll feel more inspired to lend a helping hand where it's needed to make the community a better place to live for you and your neighbors! 

Owning a home means space for growth. You have enough room to do just about anything, including starting a family!

You get to choose the neighborhood you want your children to grow up in. That includes selecting the appropriate school…

2004 Views, 0 Comments